
As of September 26, 2026, the best available answer is mixed: the World Cup appears to have stirred MLS ticket interest, yet the first broad post-break attendance comparison does not show an immediate league-wide increase in crowds. That distinction matters if you are trying to judge whether a month of global soccer attention translated into larger reported MLS crowds every week.
The answer: ticket interest rose, but the attendance bump is unproven
Sports Business Journal's September 16 analysis counted 154 MLS regular-season matches from the league's July 16 restart and found an average announced attendance of 22,098. That was 1.7% lower than the comparable stretch in 2025. Some headlines round the change to roughly 2%; the more precise published comparison is 1.7%. The number is nearly flat against the league's own pre-break 2026 average, rather than evidence of a sudden leap after the tournament.
At the same time, Front Office Sports reported substantial ticket-sales gains claimed by individual clubs during the World Cup period. Those signals deserve attention. A transaction or a claimed promotional ticket, however, cannot be silently counted as a fan at a game. Buyers may purchase for a later fixture, accept a free offer without using it, or go to one showcase game without forming a lasting habit.
Therefore the defensible verdict is narrower than either “the World Cup transformed MLS attendance” or “nothing happened.” MLS had meaningful sales and attention signals, but the first large crowd sample did not yet show a broad immediate bump. A fuller answer will need season-end data and subsequent seasons, with comparable opponents, venues and days of week. This article separates those measures so the promising commercial activity does not obscure what the reported crowd figures actually say.
What the post-break attendance count actually measures
An attendance average is a count of the announced crowds divided by the games in its sample. The choice of games and the comparison period are therefore part of the finding, not background details. The September analysis covers MLS regular-season games after the competition resumed from its World Cup pause. It excludes a one-off All-Star showcase and does not predict the final 2026 season average. It also stops in mid-September, leaving later fixtures outside the snapshot.
The 154-match comparison and its baseline
Across those 154 matches beginning July 16, SBJ calculated 22,098 fans per match. Comparing the same portion of the 2025 calendar produced the 1.7% decline. That comparison is more relevant to an immediate post-break question than setting a partial 2026 stretch against a full-year 2025 average, because a full season has a different mix of dates and opponents.
The same report put 2026 season-to-date attendance at 22,106, up 1.1% over the corresponding 2025 point. Meanwhile, MLS had announced 22,109 per game through late May, before the World Cup pause. These two 2026 averages are strikingly close, but that does not prove that every market behaved the same way. They describe league aggregates, in which a sold-out large-stadium event can balance several ordinary dates elsewhere.
A reader may also see the roughly 21,988 full-season average for 2025 in league records. That is a real historical benchmark, but its denominator includes the entire 2025 schedule. It should not be used to claim that the specific 154-game 2026 stretch improved without aligning the windows. The strongest available short-window result remains a small year-over-year decline, surrounded by uncertainty over why it occurred.
Why dates and match mix matter
“Post-break” is the careful label for the SBJ window. MLS restarted on July 16, while the World Cup final came on July 19. A few of its first sampled fixtures therefore happened while the tournament was still being played. Calling every one of those 154 matches “after the World Cup” would overstate the precision of the label, even if most of the sample falls later.
Calendar design is a second obstacle. SBJ reported 47 midweek matches from July to mid-September 2026, versus 14 in the same 2025 window. About one-third of the 2026 post-break fixtures fell on weekdays, compared with roughly 12% before the break, and the reported weekday average was 11% below the weekend average. A Wednesday game in a school or work week faces a different attendance environment from a Saturday night event. That helps explain why an unchanged headline average cannot by itself measure new fan interest.
It would also be a mistake to “correct” the number mentally and declare a hidden World Cup bump. We do not have a published counterfactual that holds day of week, opponent, venue, weather, ticket offers and local conditions constant. The schedule imbalance is a credible confounding factor, not proof of a larger attendance result. The honest conclusion is that the observed gate figure is slightly down in the comparison even while a busier midweek slate makes simple causal interpretations unreliable.
Why ticket sales and audience metrics tell different stories
There are several plausible paths from World Cup curiosity to MLS growth, and they become visible at different times. Someone can search for an MLS game, follow a club on social media, buy a ticket for October, watch a stream and then attend a match. Each step is meaningful, yet only the last step contributes to the crowd at that match. Treating all the preceding actions as attendance would turn a useful early signal into an inflated outcome.
Reported sales gains and free-ticket promotions
Front Office Sports reported on July 22 that Philadelphia Union and Nashville SC said their ticket sales had risen 218% and 161%, respectively, since the World Cup began. Those striking percentages tell readers clubs saw a burst of transactions, but the report does not make them league-wide counts of people who attended after the final. A percentage can also reflect a modest starting level; without consistent transaction totals, fixture dates and redemption rates, it should stay attached to the clubs' own sales claims.
The same reporting said New York Red Bulls had more than 5,000 claims for a free-ticket promotion. That is a particularly clear reason to keep the metrics separate. A claimed no-cost ticket might introduce a first-time supporter to a team and be a smart acquisition campaign. Yet a claim is neither paid demand nor a confirmed turnstile entry. Whether those people return at standard prices is another question altogether.
Sports Illustrated later described an MLS-reported 62% rise in ticket sales when comparing 40-day windows around the tournament. The phrase “around the tournament” matters: the comparison is not a completed before-and-after attendance study. SI also noted 35,197 at the All-Star Game. That event can show enthusiasm for a soccer spectacle, but it is a single exhibition with special pricing, participants and promotion. It should not be added to a regular-season average or used to characterize the typical club's Wednesday gate.
Sales may lead attendance by weeks or months, particularly where clubs sell future matches or next year's season packages. SBJ reported that MLS cited a 23% increase in new 2027 season-ticket purchases among 24 clubs already selling them. That could become an important long-term conversion result, but the purchased seats belong to a future season. The purchase itself cannot answer the narrower question of how many people entered stadiums in summer 2026.
The viewership number that predates the World Cup
The frequently repeated “62% viewership growth” figure refers to a different metric and an earlier period. MLS published it on May 29, 2026, reporting 7.9 million average weekly viewers, up more than 62% year over year. The league released that result before the World Cup began. It may show that MLS entered the summer with stronger viewing reach, but by definition it cannot demonstrate that the tournament subsequently caused viewing to rise.
Viewers, tickets sold and actual crowds can move in different directions without contradiction. A star matchup can fill a large venue but have modest television reach, while a widely watched match may play in a smaller stadium. Fans can also sample highlights without attending a game. The World Cup impact question deserves a separate post-tournament viewing comparison and, above all, a consistent match-attendance series. Mixing dates and denominators makes an exciting headline easier to write, but leaves readers less able to judge the real change.
Where the crowd story differs by club and match
A league average compresses 30 local markets and many kinds of fixtures into one number. It can be useful for a broad claim, but it conceals the experiences of clubs whose stadiums, opponents and promotions differ sharply. Fans seeking proof of a World Cup lift may point to a packed September venue; skeptics may point to an ordinary midweek crowd. Both observations can be real without settling what changed across the league.
Chicago's September record and the star-power effect
Chicago Fire FC reported 63,094 at Soldier Field for its September 9 draw with Inter Miami, a club record. That was a post-World-Cup regular-season crowd and an unmistakable sign that a huge audience could still be drawn to an MLS fixture. It is also an unusual event: Miami is a marquee opponent, Soldier Field offers a much larger capacity than many soccer-specific grounds, and Chicago had its own star attraction in Robert Lewandowski. A record night is a powerful club story, not a randomized test of what the World Cup did to the average match.
Even the phrase “sold out” needs context. A sold-out section or stadium configuration has a different capacity from another club's venue. Similarly, moving a match to a large football stadium can create a six-figure-looking headline comparison while leaving regular home-game demand unchanged. That is why a durable league trend should be measured across ordinary and marquee dates alike. Chicago's achievement should be celebrated on its terms, then placed beside the many games that make up the 22,098 average.
The Fire match illustrates another timing problem. A fan who attended for Miami may have loved the World Cup, followed Messi for years, supported Chicago already, or simply accepted an appealing ticket offer. An attendance total cannot identify those motivations. The club could learn more through first-time buyer surveys and later repeat visits; the public gate count alone cannot assign each attendee to one cause.
Big crowds were already possible before the tournament
Pre-tournament examples make the baseline especially important. MLS reported in May that Colorado had drawn 75,824 on April 18, LAFC 75,673 on February 21 and D.C. United 72,026 on March 7. Those matches took place before the World Cup. Their existence does not diminish any later crowd, but it prevents us from treating every large 2026 stadium event as a novel post-tournament phenomenon.
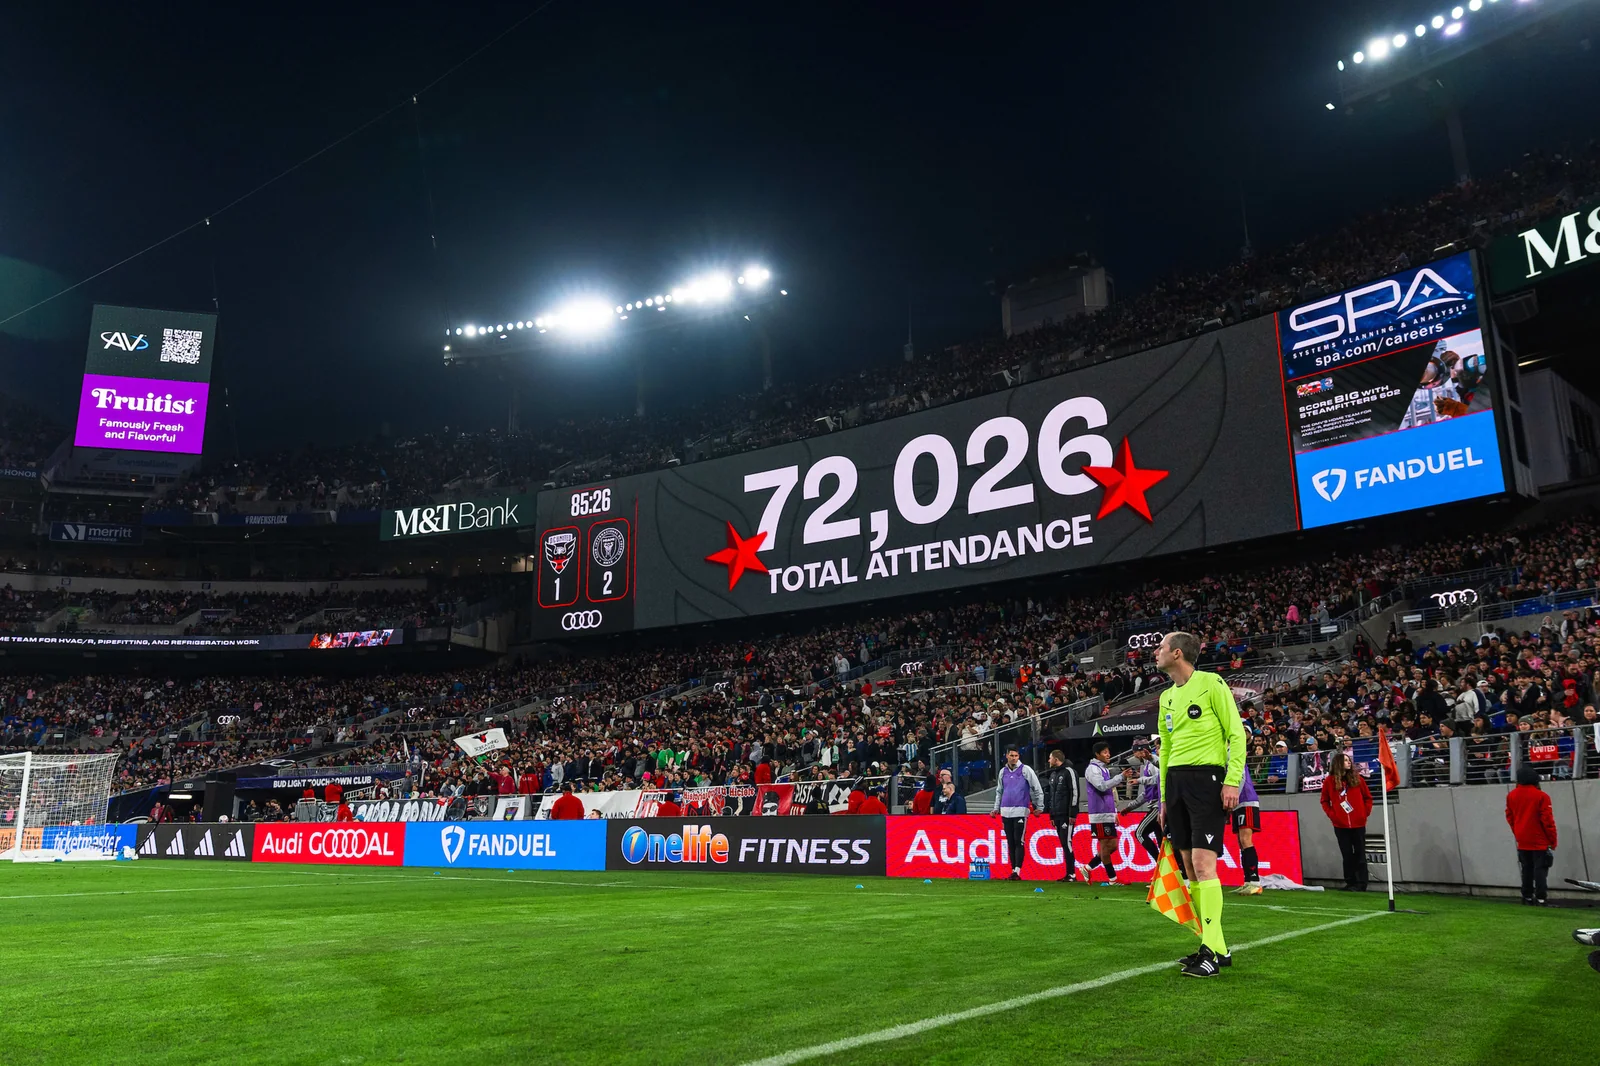
There is no single “normal” MLS gate that can be read from those showcase matches either. A 22,000-seat soccer stadium can sell every available ticket and still report a lower attendance than a half-full football venue. Conversely, a 60,000-plus game can dominate national headlines without reflecting the usual capacity or demand of its club. For a World Cup effect, the interesting question is whether comparable games at comparable venues attracted more people than they would have otherwise, and whether those people came back.
Club-level variation may ultimately be the most informative part of the story. The tournament was staged in some MLS markets and not others, clubs differed in marketing budgets and opponents, and star signings changed local appeal. A national mean remains an essential starting point, but an analyst should split the data by market, game type and time before assigning a benefit to the World Cup. As of late September, those richer public comparisons are still limited.
What would establish a lasting World Cup effect
A true legacy question is longer than a seven-week attendance chart. The strongest evidence would show that people who discovered or rediscovered MLS during the tournament began attending ordinary league matches, then continued to attend once the special promotions and national-event excitement faded. That requires following comparable matches and customers beyond September rather than choosing the most flattering single statistic.
Compare like-for-like games over a longer period
A useful study would start with every club's regular-season gates before and after the pause, then compare equivalent parts of 2025 and 2026 and eventually 2027. It would separate weekends from weekdays, stadium changes from stable venues, and matches against marquee opponents from routine fixtures. Ticket prices and promotions would matter too. In a 30-team league, a few unusually large dates can pull up the mean while median or typical-game attendance tells a different story.
Analysts should also say whether they are working with announced attendance, tickets distributed or actual scans through the gate. Public MLS figures are generally announced attendance, so they remain valuable for consistent historical comparison, but they do not necessarily reveal how many seats were physically occupied. The distinction becomes especially important when discussing complimentary-ticket campaigns. If an organization later publishes verified entry counts, those would answer a different and useful question; they should not be merged silently with older announced figures.
Finally, a good comparison would explain its calendar endpoint. September 16 was an early snapshot, and MLS had not completed the 2026 regular season. A final-season average, then an equivalent set of 2027 dates, could reveal whether a weak immediate crowd response gave way to delayed demand. The early 1.7% decline might persist, narrow or reverse. At this stage, none of those future outcomes should be written as a certainty.
Track conversion from curiosity to repeat attendance
Teams can measure something a public aggregate cannot: whether new buyers return. An encouraging sequence would be a World Cup-period enquiry, a paid first visit, another paid visit for an ordinary opponent, and perhaps a 2027 season package. A pre-tournament analysis of MLS's World Cup opportunity framed conversion into durable fandom as the central challenge. The term “durable” means more than one viral game night.
SBJ reported that MLS cited a 23% gain in new 2027 season-ticket purchases among the 24 clubs already selling packages. That is a potentially encouraging forward signal, but several limits remain: it is a subset of clubs, the report does not attribute each buyer to the World Cup, and the tickets are for a season that has not yet played. The clearest follow-up will be renewals, actual match use and attendance at dates without exceptional draws. Those indicators may reveal a lasting benefit even if summer 2026's immediate gate average stayed nearly flat.
For fans making their own judgment, the most useful habit is simple: check a claim's date, unit and denominator. “Up 62%” could refer to a pre-tournament television audience, a sales window or a club's marketing response. “22,098” refers to average announced attendance in a specified set of regular-season matches. Those are different questions with different answers; keeping them distinct makes the World Cup legacy more interesting, not less.
Frequently asked questions about MLS attendance after the World Cup
The short answers below use information available through September 26, 2026. They can change as more matches are played and clubs publish additional customer or attendance data. When comparing a new report with this snapshot, first check whether it counts regular-season gates, ticket purchases, claims of free offers or viewing audiences.
Did MLS average attendance rise immediately after the World Cup?
Not in the most useful published same-period comparison available in mid-September. SBJ found 22,098 announced fans per match over 154 games from the July 16 restart, 1.7% below the comparable 2025 stretch. Because that window begins three days before the World Cup final and has a heavier midweek schedule, it should be described as an early post-break observation, not a final verdict on every match played after July 19.
Did MLS ticket sales increase after the tournament?
Several clubs and the league reported increased sales or purchase interest during the World Cup window. Front Office Sports cited sizable Philadelphia and Nashville sales gains, while Sports Illustrated reported a league-level 40-day sales comparison. Those reports support an increase in ticket activity, with their own dates and definitions. They do not establish an equivalent increase in fans present at MLS regular-season matches, and they cannot tell us how many new buyers will attend repeatedly.
Does the 62 percent TV growth figure measure the post-Cup period?
No. MLS announced 7.9 million average weekly viewers and more than 62% year-over-year growth on May 29, before the 2026 World Cup. It is a pre-tournament viewing figure. A post-tournament TV or streaming analysis would need a later viewing window and the same measurement basis. Until then, the May figure is context for MLS's starting position, not evidence that the World Cup raised viewership after it ended.
For current match dates and possible chances to see whether interest carries forward, use our MLS schedule for this weekend. The next meaningful update to this analysis should revisit the comparable crowd sample after the regular season, rather than merely adding another impressive one-game anecdote.
Comments
Comments are reviewed before publication.
Spam, abusive content, personal information and policy-violating links are not published.
Sign in with Google to comment or reply.
Loading comments…